Archive for the ‘Cancer’ Category
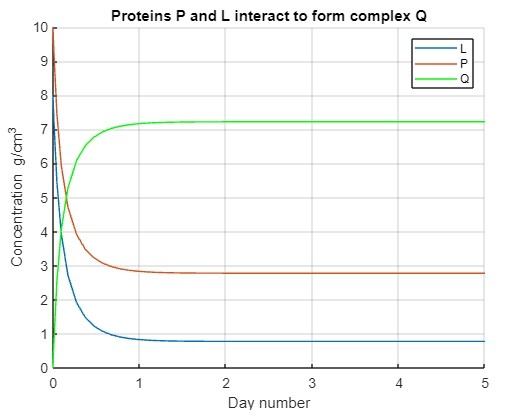
Suppose two species of proteins, P and L, interact to form a complex Q at a rate k1, while Q breaks down to its components P and L at a rate k-1. Here P , L and Q are taken as concentrations, with unit g/cm3. The reaction rate k1 is taken in unit of cm3/g · day, while the k-1 is taken in unit of 1/day. First, the differential equation has been simulate in Simulink and its results has been proccesing with MATLAB (figure has been made using MATLAB code)
Dr. Jorge Luis Mírez Tarrillo
Group of Mathematical Modeling and Numerical Simulation (GMMNS). Universidad Nacional de Ingeniería. Lima, Perú.
E-mail: jmirez@uni.edu.pe
Website Personal: https://jorgemirez2002.wixsite.com/jorgemirez
Facebook http://www.facebook.com/jorgemirezperu
Linkedin https://www.linkedin.com/in/jorge-luis-mirez-tarrillo-94918423/
Scopus ID: https://www.scopus.com/authid/detail.uri?authorId=56488109800
Google Scholar: https://scholar.google.com/citations?user=_dSpp4YAAAAJ
MATLAB Group Admin in Facebook: https://www.facebook.com/groups/Matlab.Simulink.for.All
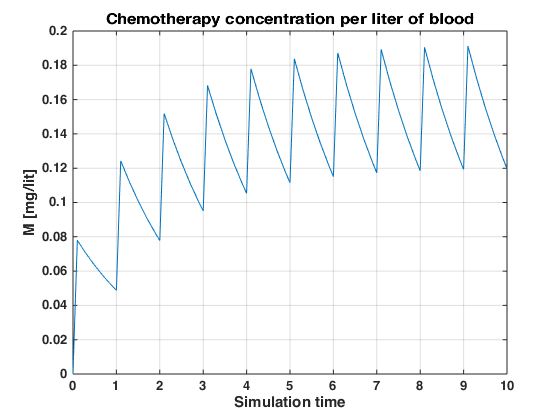
Revisando la información encuentro una ecuación diferencial de primer orden en el que se describe la evolución de la cantidad de químicos en la sangre durante una quimioterapia. La forma aserrada de la curva es porque se hace la inyección del químico en el 10 % de una unidad de medida de tiempo (usualmente es la hora) y dicho % puede variar – dado que es un modelo matemático – la tendencia hacia un valor máximo indica un equilibrio entre lo que puede ingresar y puede ser acumulado en la sangre. Hecho en MATLAB en mis investigaciones sobre cáncer.
Dr. Jorge Luis Mírez Tarrillo
Group of Mathematical Modeling and Numerical Simulation (GMMNS)
Universidad Nacional de Ingeniería, Lima, Perú.
Facebook http://www.facebook.com/jorgemirezperu
Linkedin https://www.linkedin.com/in/jorge-luis-mirez-tarrillo-94918423/
Scopus ID: https://www.scopus.com/authid/detail.uri?authorId=56488109800
Google Scholar: https://scholar.google.com/citations?user=_dSpp4YAAAAJ
E-mail: jmirez@uni.edu.pe
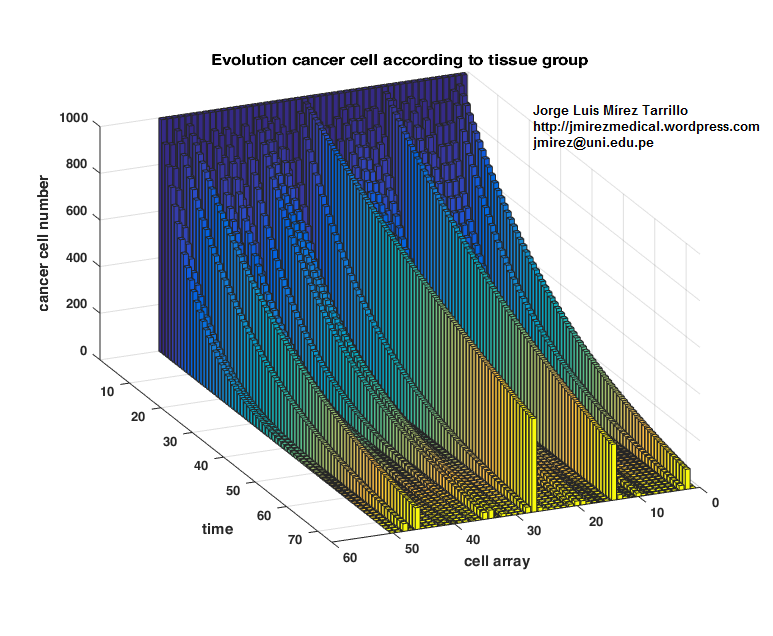
The graph shows in time line the reduction in the number of cancer cells with different proliferation rate and therapy effectiveness in a positively evolving patient… Made in MATLAB using differential equation.
Dr. Jorge Luis Mírez Tarrillo
Group of Mathematical Modeling and Numerical Simulation (GMMNS)
Universidad Nacional de Ingeniería, Lima, Perú.
Facebook http://www.facebook.com/jorgemirezperu
Linkedin https://www.linkedin.com/in/jorge-luis-mirez-tarrillo-94918423/
Scopus ID: https://www.scopus.com/authid/detail.uri?authorId=56488109800
Google Scholar: https://scholar.google.com/citations?user=_dSpp4YAAAAJ
E-mail: jmirez@uni.edu.pe
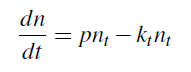
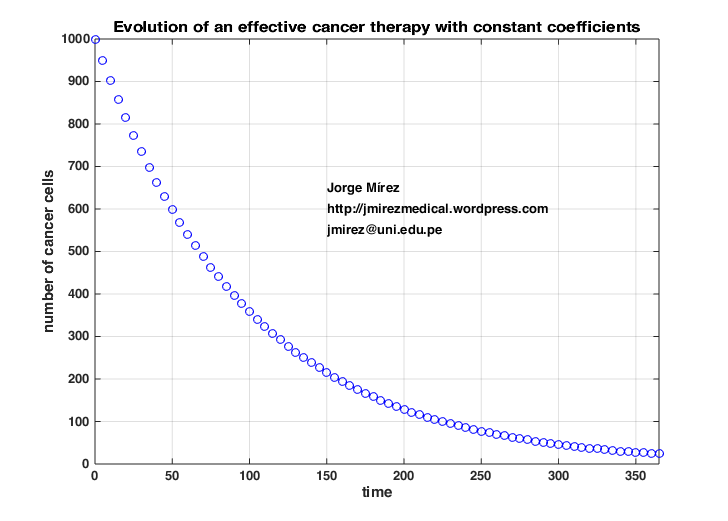
Hello readers, this figure shows the evolution of the differential equation where nt is the number of cells at time t; p is the proliferation rate of the tumor; kt is the therapy effectiveness at time t and so ktnt denotes kill rate. Made in MATLAB. I invite and welcome all support and collaboration to continue with research. Note: In this case, p and kt are constants in all simulation time.
Dr. Jorge Luis Mírez Tarrillo
Group of Mathematical Modeling and Numerical Simulation (GMMNS)
Universidad Nacional de Ingeniería, Lima, Perú.
Facebook http://www.facebook.com/jorgemirezperu
Linkedin https://www.linkedin.com/in/jorge-luis-mirez-tarrillo-94918423/
Scopus ID: https://www.scopus.com/authid/detail.uri?authorId=56488109800
Google Scholar: https://scholar.google.com/citations?user=_dSpp4YAAAAJ
E-mail: jmirez@uni.edu.pe
The types of available models focused on cancer biology range from general models, e.g. tumour growth, angiogenesis and signalling transduction pathway models, to specific models, e.g. behaviour in response to specific stimuli. Models of biological processes are employed for diverse research purposes, notably, inquiries into fundamental tumour dynamics and drug target prediction. Algorithms used by these models range from differential equations, use of fractal theory, stochastic approaches and more recently artificial intelligence techniques such as clustering and classification, neural networks, application of fuzzy logic, inductive/ stochastic logic programming, Bayesian networks and many more. Epidemiological models are also abundant in the literature, which are informative for the clinician in terms of modelling prognoses and diagnoses given various biological
data. The types of models presented in this report have been broadly categorised into the following classifications: Growth Models, Angiogenesis Models, Treatment Response Models and Dynamic Pathways Models. Of course not all of the models
presented here can be strictly classified into these types – in reality, all are hybrids to some degree but most comfortably fall into one of the categorisations, as portrayed by Figure. Thank you very much.

Source: Manish Patel, Sylvia Nagl. The Role of Model Integrationin Complex Systems Modelling – An Example from Cancer Biology. 2010 Springer-Verlag Berlin Heidelberg. ISBN 978-3-642-15602-1. DOI 10.1007/978-3-642-15603-8
Dr. Jorge Luis Mírez Tarrillo
Group of Mathematical Modeling and Numerical Simulation (GMMNS)
Universidad Nacional de Ingeniería, Lima, Perú.
Facebook http://www.facebook.com/jorgemirezperu
Linkedin https://www.linkedin.com/in/jorge-luis-mirez-tarrillo-94918423/
Scopus ID: https://www.scopus.com/authid/detail.uri?authorId=56488109800
Google Scholar: https://scholar.google.com/citations?user=_dSpp4YAAAAJ
E-mail: jmirez@uni.edu.pe
Blog in ENGLISH

Compra/Buy Dona/Donate con/with Paypal to my account/hacia mi cuenta jorgemirez2002@gmail.com

Compra información o código o haz tu donación, esto va a permitir seguir trabajando en brindar más información en este blog. Mi cuenta en PayPal es jorgemirez2002@gmail.com. Cualquier monto es bienvenido.
Datos Generales
Good day. My full name is Jorge Luis MIREZ TARRILLO.
I am Peruvian. I live in Lima, capital of Perú in South America.I studied Mechanical Electrical Engineering, MSc Physics and Dr Physics (title thesis: Control, Optimization and Management of Microgrid Current Direct)
Too, actually job as Professor in Faculty of Sciences anf Faculty of Oil, Gas and Petrochemical of the Universidad Nacional de Ingeniería (National University of Engineering) in Lima – PERU.
My subjects of me interest are: control, signal processing, optimization, simulation, biomedical research, smart grid, microgrid, water.
I have experience in: Matlab/Simulink, biomedical engineering, electrical systems, smart grids, microgrids, revewables energy.
